Data:In Place: Making open data work for communities
Design Futures


Abstract
Discover data about your place through a geographic information system (GIS) tool.
Method
A platform that uses Application Programming Interfaces to make official open data about places in the UK more accessible, through a place based querying system that works through your web browser.
Takeaways
Making it easy to see open data at-a-glance and giving non-experts access to this data in ways that normally only experts would have access to.
It all started with a simple statement: "Open data should not only be open, but also accessible and understandable for everyone".
Data:In Place is a tool that helps people to understand data about the places that matter to them. It builds on existing open-source software that visualises data and makes it simple for anyone to understand.
The tool was created through an intensive co-design process, to understand the value of open data for communities and how they might access it. This process highlighted the importance of providing context to data and connecting it to places that people wanted to know more about.
We’re not bothered about p-values or anything like that, or whether or not it satisfies the criteria. It’s visually… That visually, to us, looks good, that’s all we care about.
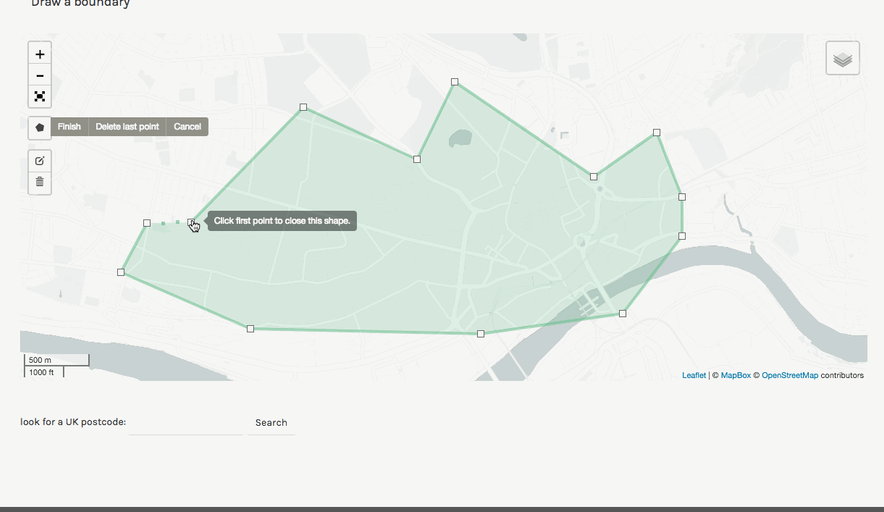
That’s why Data:In Place allows people to access data through a map. Drawing a boundary around any place in the UK reveals lots of open data about that place. The tool is also designed for collaboration and increasing the social capital of communities, allowing you to add your own data or propose ‘data challenges’ for where data might be lacking.
Data:In Place has been used by neighbourhood planning groups to gather evidence for policymaking. It’s also been used by local charity organisations to better understand the needs of communities and illustrate their impact for extending funding bids to continue their work.

How it works
The system uses official open datasets from around the UK, including crime statistics, travel to work data and population density, and allows you to view them on a map of your area.
Draw a shape around an area that you’re interested in, such as your local neighbourhood, and see what data is available.
The tool also allows you to add your own data and suggest challenges for the places where more data might be needed, to start a conversation about data and places.
Check out the tool for yourself by visiting the Data:In Place website.